Evaluating Enterprise Cloud Stocks Through A Thematic Growth Lens
Despite generally meeting and raising revenue and customer growth projections in the most recent quarter ending June 30, 2019, many enterprise cloud computing stocks have been hit with a severe drawdown in September as investment flows shifted from growth to value. A key question is whether this rapid change in investor preference is an inflection point in terms of a willingness to support high multiples, or could it mean a brief period of consolidation that will lead to continued growth and stock gains when investors’ desire for growth reignites buying interest?
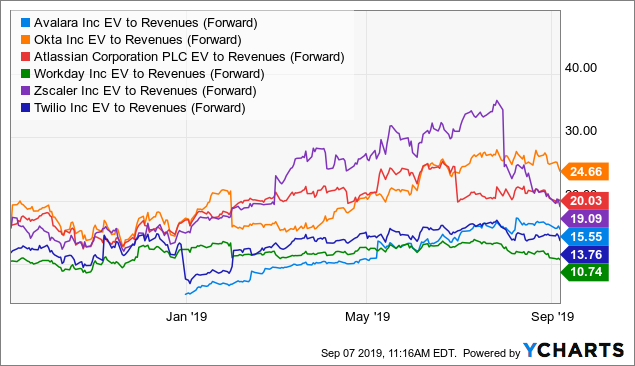
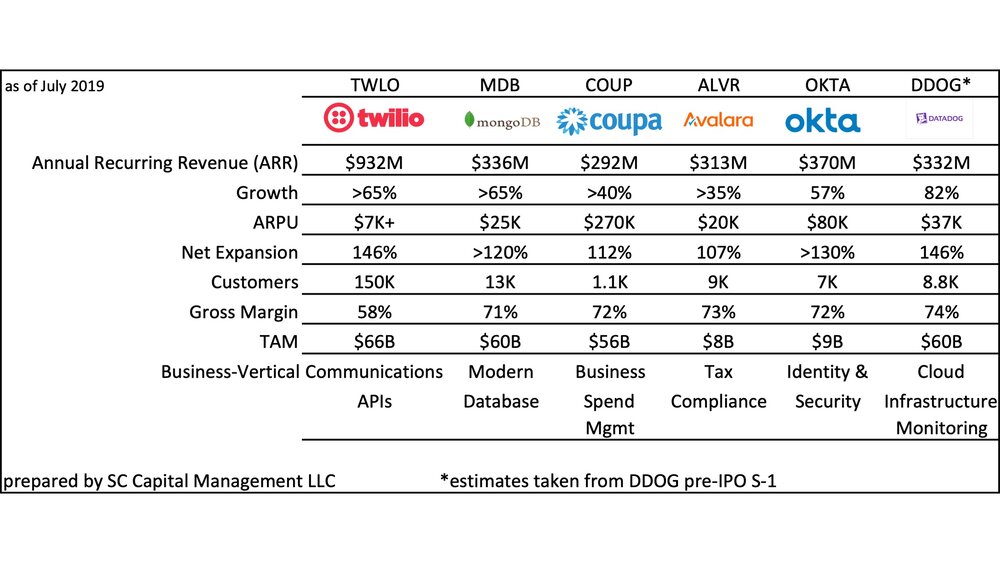
Selected enterprise cloud computing stocks
The frothy enterprise cloud computing sector of the tech industry has earned high valuations (on EV/sales basis) based on superlative growth metrics, high gross margins, recurring-revenue business models and a customer base of enterprises that are in the sweet spot of digital transformation. Enterprise software spending is projected to grow 8.5% from 2018 to 2019, and another 8.2% in 2020, for a total of $466 billion, according to Gartner. There is no higher quality growth in the market today than this sector which is part of the much larger $3.8 billion IT industry. Cyclical vulnerability is always a real risk factor for top-line growth stories. Yet the combination of higher forward revenue guidance and recent stock price declines makes the frame of reference for decision making more than the simple arithmetic of lower multiples. Investors looking for entry points or justification to re-balance portfolios can benefit from a thematic lens for decision making in this sector – in addition other traditional metrics that relate to financial performance and risk.
Long-term themes differ from short-term trends, and so should the methods of evaluation. Themes have a narrative component and work over many years. For example, there is limited insight into the future potential of these high-growth companies through the structured confines of discounted cash flow (DCF) modeling. Projecting annual changes to working capital and terminal growth rates ten years out can bury so many layered assumptions so as to make false precision as pernicious a behavioral bias as the ones that infest thematic investing (didactic aesthetics).
Traditional accounting methods – based on historical data and equipment-based capex spending – can distort the picture of an enterprise cloud computing platform designed for the labeling, ingestion, cleaning, visualization, and analysis of data in ways never before contemplated. Stated a different way, the yoke of linear, mechanical thinking in the face of innovation that is geometric in scale can fatally diminish the opportunity set of potential outcomes for these opportunities, all in the service of adhering to a standard that dictates a very simple bounded optimism: the past is indicative of the future and all trends mean revert.
Amazon
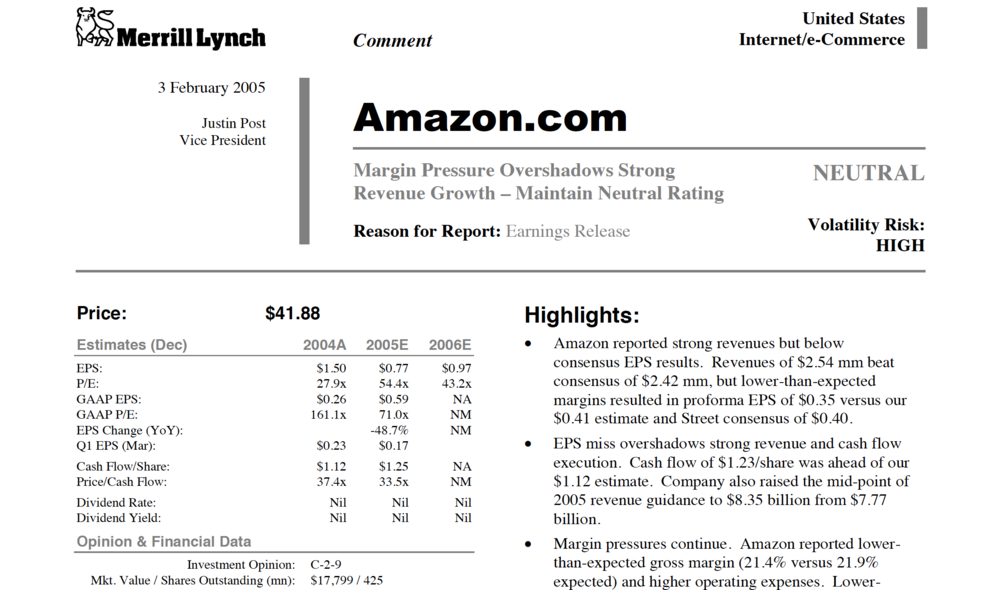
Looking back at Amazon during its formative years illustrates why investors should devote time and energy to developing themes to evaluate growth industries and companies for potential investment. In 2007, the wildest Amazon bull estimated that 13 years from then (in 2020) Amazon was going to produce nearly $40 billion of revenues. Today, 12 years later, the average sell-side analyst thinks Amazon will do over $320 billion of revenues in 2020. Amazon’s reward to investors over this period is about 50x. Over the last 15 years or so, there were two major themes, (consumer) e-commerce and (enterprise) cloud computing, that provided multiple entry points for a winning investment in Amazon.
Today’s Thematic Lens
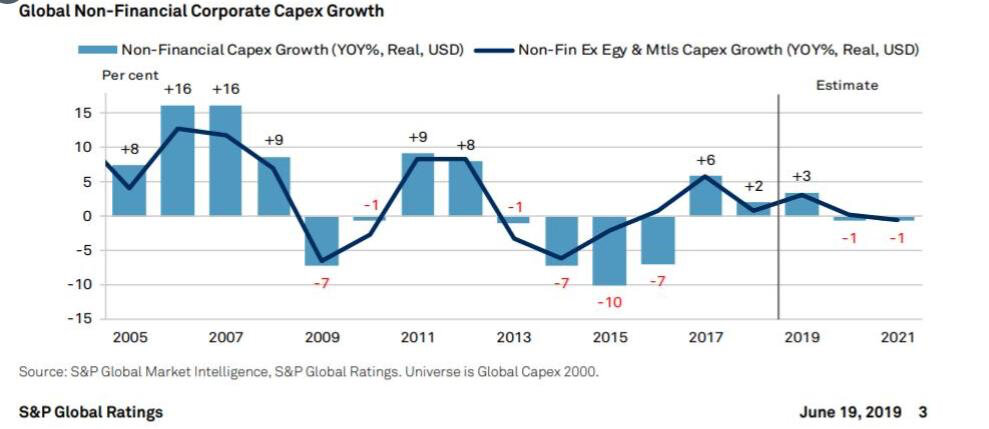
There are several factors at work today that suggest using a thematic approach can help clarify the future potential of enterprise cloud computing stocks in ways that escape the simple accounting treatments of historical financial performance. The first is the generational shift away from traditional capital expenditures (“capex”) spending and towards operations spending (“opex”). It used to be that capex supported infrastructure capabilities. Today value creation is happening through opex. This shift makes sense for an economy leaning towards knowledge and service workers and away from factory workers. GAAP accounting was designed to quantify corporate investments in future growth along with a method to expense the cost over the many periods that make up the assets’ useful life. What is obvious now is that both R&D and capex spending have different implications for a software company compared to a traditional industrial company.
Hosting code on servers that is variably priced based on product demand means the balance sheet for many of the cloud-based companies contains relatively few items: cash, receivables (that are largely irrelevant when the product is often pre-paid monthly), and office leases. In one case, Atlassian, which makes software for teams to work together more efficiently, grew revenues to nearly $2 billion with relative little marketing and advertising. At the time of their IPO in 2015, only 19% of their revenue was spent on sales and marketing, a fraction of the spend compared to other companies of their size and growth, and it had no sales employees. For these companies, growth is achieved through geometric scaling via word-of-mouth and relatively low reinvestment. Products in this sector are optimized for performance in real time instead of being machined out of metal and then used with little modification over many years. These types of efficiencies were never contemplated by GAAP accountants who could only imagine the symmetry of more revenue resulting from the addition of more PP&E (property, plant and equipment). What is replacing PP&E is intangibles like information, IP, code and branding. In high-growth environments, intangibles produce asymmetrical outcomes and potentially huge investing rewards. Even the word “intangible” sounds like an accounting step-child.
Writing code to create a product with monthly recurring revenues and no marginal cost of production is a fantastical method of drilling leverage into a business model. The often-cited reason Amazon was considered to be a risky or bad investment was because it was not like Borders and Barnes & Noble – it’s quality was asymmetrical to the norm. Amazon’s spending ramp for its cloud computing business started in 2006 with costs that reduced margins, much to the consternation of investors. Some investors, especially those who adhere to value investing principles, wrote off Amazon for having a P/E ratio that was at times greater than 100.
Conflating R&D with innovation is another nuance to the accounting problem. For example, in 2006, Ford’s R&D spending ($8 billion) was the second highest in the world (after Pfizer) and even higher than Microsoft and Johnson & Johnson. By comparison, Amazon launched Amazon Elastic Compute Cloud (EC2) in the same year. It pioneered the field of “infrastructure-as-a-service” (IaaS) by presenting a virtual computing environment allowing customers to use web interfaces to requisition servers remotely. Amazon’s 2016 capex spending was $175 million, or about 2% of revenue, and its R&D spending was a tiny of fraction of Ford’s at $662 million. And estimates of Amazon’s cloud computing revenues that year suggest a figure less than $50 million. Over this period, from 2006 to today, Amazon’s 50x return compares to Ford’s return of approximately zero.
The second thematic issue is the “re-platforming” of the enterprise across every industry and geography on the globe. The impact is nothing short of leveraging the computing base of whole industries to make workers more efficient and to squeeze cost and friction out of entire business models using variable, subscription software hosted in the cloud. The roots of this massive theme point directly to Amazon’s launch of its IaaS business in 2006. There were earlier signs of the epic changes that would lead to the launch of a generation of fast-growing cloud computing companies, many of which were built with Amazon’s cloud business, now called AWS. Om Malik’s insight about the emergence of these faster, cheaper software companies highlighted one of the greatest computing insights of this generation. In his 2003 article, “The Rise of the Instant Company,” Malik says, “Kolluri and Neoteris are pioneers in a new era in the tech world. Call it the age of the instant company. Commoditization – the process by which technology products become standardized and their prices are shoved relentlessly downward – has now driven the cost of the building blocks of tech so low that hardware expense has been all but eliminated from the equation of creating new products.”
Opex Re-Platforming
Opex re-platforming means leveraging an enterprise’s most productive employees to perform even better. It also means freeing up the least productive employees to focus less on the drudgery of repetitive processes. By pushing scalable business logic into the places least-resistant to innovation, efficiencies multiply leaving competitors no choice but to innovate. There is no need for meaningful capex spending. The economics of digital transformation has spread to almost every function and vertical of the enterprise including database, tax compliance, cost productivity & procurement, communications, human resources, customer acquisition, biology and human physiology.
Achieving cost efficiency can be infectious to competitors and internal teams. The teams implementing cost efficiency initiatives are converted from being a cost to being a catalyst for earnings. In the finance function, for instance, FedEx automates tax, payroll, credit card reconciliations, treasury and other finance processes with robotic process automation (RPA) in the global shared services organization. Fossil Group uses RPA to automate the monthly financial close process. RPA companies are the fastest growing part of the cloud computing sector with sustained annual growth rates above 60%.
Example: Blue Prism
Blue Prism PLC (“BP”) is among three leaders in an emerging RPA industry that, along with other more mature SaaS/cloud enterprise software firms, is pioneering digital robotic innovation through automation and the surfacing of new data sets that were not available just five years ago. These new data sets resist mean reversion because the discoveries between data and actions were previously too quanderous for humans to perceive or were simply impossible to discern and diffuse. Embedded inside this niche industry and company is the full potential for AI to draw lessons from its own experience – unlike traditional software that can only extend human actions (deterministic) – and the fast-emerging capacity to translate basic human reasoning into business logic (probabilistic) for machines. Absorbing this new technology into organizational values and practices presents challenges, but they are fast melting away against the payback profiles for RPA deployments that can be measured in terms of months or less and the trend towards more task-oriented entry points for first-touch applications that are low-risk, high-value automations.
BP’s connected-RPA SaaS offering provides large enterprises with an intelligent digital workforce (software robots) capable of self-learning and continuous improvement, empowering users to automate billions of transactions while returning hundreds of millions of hours of work back into the business. Enhancing productivity using easy graphical user interface (GUI) forms and dashboards makes this technology accessible by business users who lack deep programming skills and would otherwise require complex application development in Python or R (ie. data scientists). This type of automation employs robots to control the triggering, orchestration, execution, and termination of manual tasks often across business operations’ system boundaries. By pairing business workers with a nimble easy-to-deploy technology, businesses keep initiatives cost-effective during periods of expansion (revenues captured) and contraction (costs saved). BP pioneered RPA, which has become the fastest growing segment of the enterprise software industry, according to Gartner.
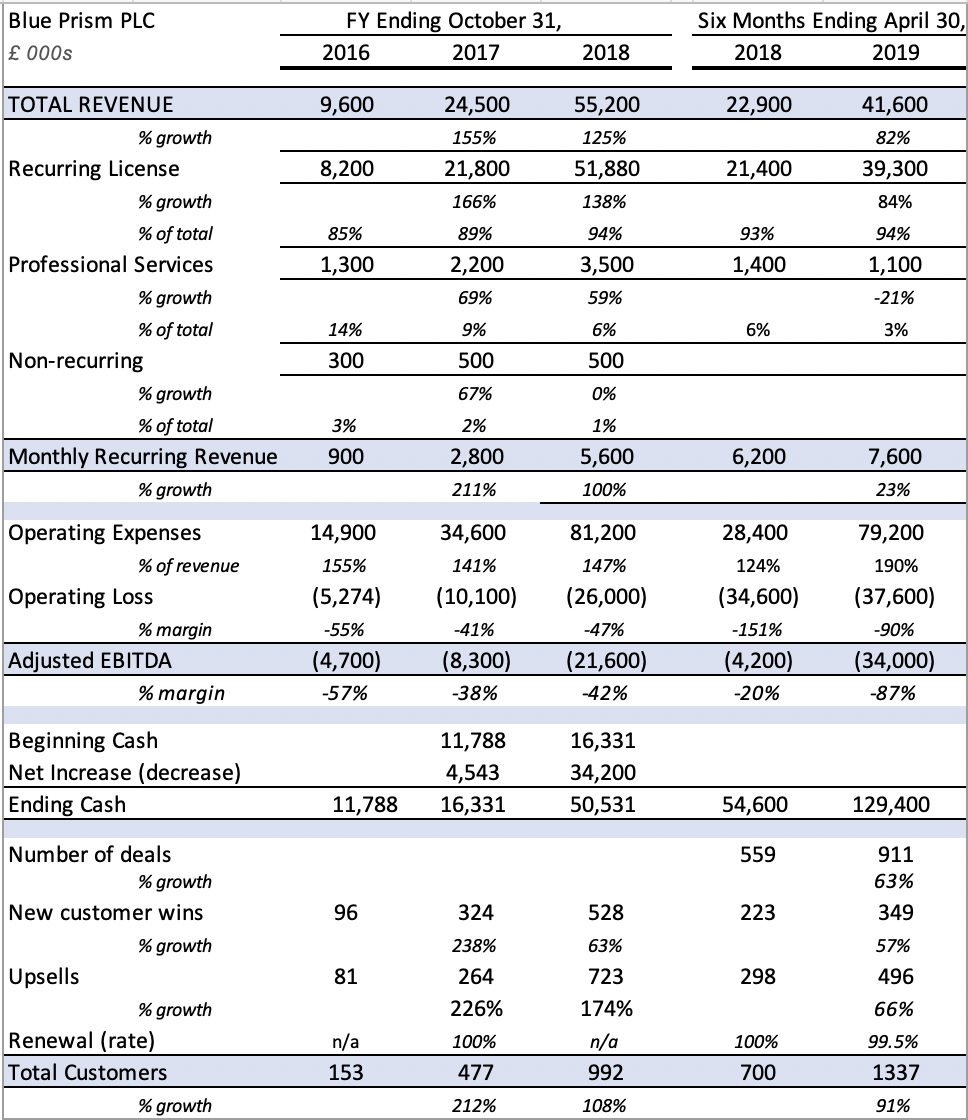
Prepared by SC Capital Management LLC based on company reports
Narrative Conclusions
Falling in love with your narratives is perhaps the most dangerous behavioral pitfall. This is where metrics meet narrative by converting the narrative conclusions into a company’s key value drivers. Then you can develop a quantitative approach to stock selection and performance tracking and review your assumptions. A good starting point is understanding a company’s addressable market. This could mean the magnitude of the problem it is trying to solve or perhaps a new way for people or enterprises to trade or interact, expressed in dollar terms. From there, estimate the company’s potential market share to determine a revenue picture 5-10 years out. A range will do. The idea is to be approximately right rather than exactly wrong. Strong competitive advantage narratives show up as a combination or high market share and high operating margin. So growth, in terms of quantity and quality, is a vital component for success in this sector. Then there are important granular details about management, competition and the industries the company serves.
Two important factors – stock selection and position sizing – are not covered in detail in this article. Also, looking only at companies in the same industry tends to bias the sample. Again, any intensely-regarded abstraction like an investment theme has the added risk of behavioral bias. Themes are for observing and revealing, and stocks are for investing, projecting and measuring. Realized risk in your portfolio will enter through individual stock selection and position sizing.
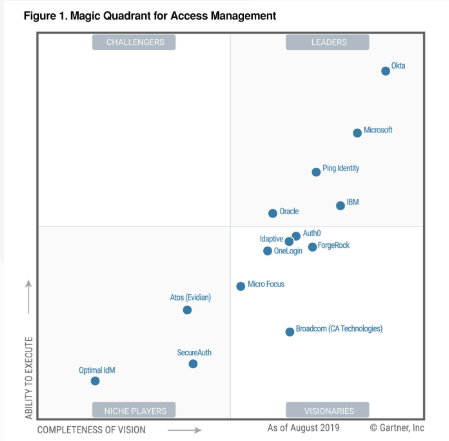
Example: Okta
Okta’s SaaS product is an enterprise-grade, identity management service, built for the cloud, and compatible with many on-premise applications. While the company competes with much larger tech companies like Microsoft, its compatibility with virtually any cloud service (not just Microsoft’s cloud) and many other software providers gives it an elasticity that is driving Okta adoption as the dominant vendor for identity management. With Okta, identity is a software layer giving employees compliant access to secure computing resources. For a company’s customer ID and tracking, Okta is intermediating as a tool for revenue generation. These two factors cause estimates of Okta’s TAM to swell when you consider how deep its tools can become integrated in the vital fabric of the Internet.
Okta reported another strong quarter on August 28th, 2019. Its revenues for the Q2-20 increased 49% to $140.5 million, beating estimates of $131 million. Net loss was $43 million, compared to $39.2 million for Q2-19. Adjusted net loss was $5.5 million, or $0.05 cents a share, compared with previous year’s loss of $16.4 million and the street’s forecast of a loss of $0.11 per share. Guidance was slightly below trend which is normal as companies grow larger. More important, the company provided an argument for improved growth quality, an important factor to consider.
By segment, subscription services revenues increased 51% to $132.5 million for the quarter. Professional services and the others segment revenues grew 19% to $8 million. Total calculated billings grew 42% to $155.8 million.
Among Okta’s key metrics, the company added 450 new customers in the quarter to end with 7,000 net customers, an increase of 36% over the year. Customers with more than $100,000 annual contract value (ACV) increased 46% to 1222.
Despite a slight slowdown in rate of growth in its guidance, Okta’s remaining performance obligations (RPO) grew by 68%, representing a backlog of $914M. The reason for the slowdown has to do with a shift in Okta’s customer base that is tilting towards bigger customers.
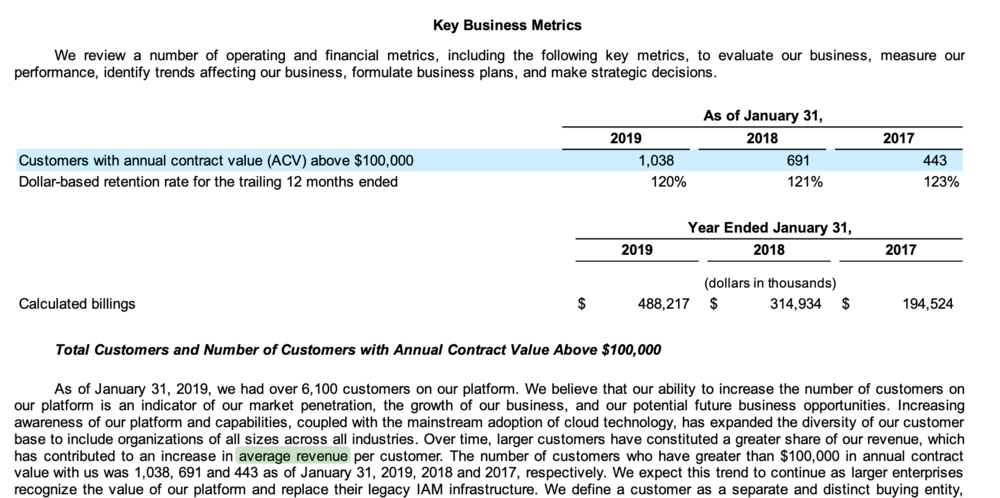
Okta annual report
Bigger companies have a different approach. They want stable partners and longer contracts when slecting suppliers and partners. Okta’s CEO Todd McKinnon said on the Q2 2020 earnings call that some of the contracts are signed for up to five years. RPO growth shows these contracts have a higher value in dollars, and their increased length will provide more stable growth for Okta. ACV confirms this shift to higher-value contracts as it has trended up from 443 in 2017. From Okta’s most recent conference call: “Average contract size of top 25 contracts booked in Q2 doubled compared to Q2 last year.” There is little doubt based on these indications that Okta will continue to outperform its own guidance and expand its lead in identity and security.
Finally, at 16% of revenues, international expansion is just getting started and is also consuming more expenses in the short-term.
Asymmetry
In 1997 Jeff Bezos made reference to accounting methods in Amazon’s first letter to shareholders: “When forced to choose between optimizing the appearance of our GAAP accounting and maximizing the present value of future cash flows, we’ll take the cash flows.” Millions of analyst trained mostly in MBA business principles perform nearly identical analyses: the mechanical evaluation of high-quality, wide-moat businesses trading at a discount based on a computer-aided screen of historical financial statements. Investors can defeat the costly error of omission by developing themes to uncover asymmetries in an investing landscape designed around the symmetry of GAAP accounting.
In 1997, Jeff Raikes, a Microsoft strategist, sent a letter to Warren Buffet outlining in simple terms why Microsoft was a great investment. Raikes’ description is nothing more than a thematic overview of the opportunity. Raikes suggests it is, “probably as good as the syrup business.”
Buffet declined to invest in Microsoft. But he did eventually invest in Amazon….in 2019 (excluding his investment in Amazon bonds in 2001).
The ideas presented in this post do not constitute a recommendation to buy or sell any security.
Investors are advised to conduct their own independent research into individual stocks before making a purchase decision. In addition, investors are advised that past stock performance is not indicative of future price action.
You should be aware of the risks involved in stock investing, and you use the material contained herein at your own risk. Neither SIMONSCHASE.CO nor any of its contributors are responsible for any errors or omissions which may have occurred. The analysis, ratings, and/or recommendations made on this site do not provide, imply, or otherwise constitute a guarantee of performance.
SIMONSCHASE.CO posts may contain financial reports and economic analysis that embody a unique view of trends and opportunities. Accuracy and completeness cannot be guaranteed. Investors should be aware of the risks involved in stock investments and the possibility of financial loss. It should not be assumed that future results will be profitable or will equal past performance, real, indicated or implied.
The material on this website are provided for information purpose only. SIMONSCHASE.CO does not accept liability for your use of the website. The website is provided on an “as is” and “as available” basis, without any representations, warranties or conditions of any kind.
Leave a Reply